
Graham Capital Management – Challenges and Opportunities for Risk Assets
Graham Capital Management – Challenges and Opportunities for Risk Assets Read More »
Graham Capital Management – Challenges and Opportunities for Risk Assets Read More »
Aspect Capital Insight Series – Capturing Unpredictability – Trend Following Alpha Read More »

QIS – a Viable Alternative to Volatility Hedge Funds? Read More »
SECOR – Costless Collar and Equity Hedging vs Tail Risk Hedging Read More »
Additional information found on Eurex’ landing page
Eurex – Daily Options Read More »
The Fruits of a Diversified Approach Read More »
Transaction Cost Analysis for Derivatives Read More »
Modernizing the Diversification Toolkit: Allocating to Defensive Alternatives Read More »
Complex macro and geopolitical events have made this a challenging environment for investors. Markets have been soaring while valuations and risks keep getting worse. Though investments have had a spectacular decade, the future may be tricky. Risk reduction will be an important consideration, but costs could be prohibitive:
SECOR’s Equity Hedging Strategy (“Equity Hedging”) is tailor-made for this environment:
In this note we will discuss four practical examples of how clients have used or are currently using our Equity Hedging strategy.

This chart shows our convex, defensive profile during our nearly five-year track record. Each point on the chart represents a day in our return series net-of-fees. For that day we compare the total equity market return during the most recent 90 days with the hedge program return over that same time-period.(1)
While we are often compared to tail hedges and passive structured equity, we are designed to be different.
First, we do not focus on black-swan tail events; there is no need. We strive to protect against significant equity losses (seeking to offset half of an equity drawdown greater than 30%) and will, by extension, naturally perform well in black-swan-type tail events.
Second, we do not look to give away extensive upside – collared equity may be premium neutral, but collars can be extremely expensive over long periods, especially when markets are volatile.
Finally, we strive for equity protection rather than volatility hedging. In our experience, most investors are long equity, but few can point to short volatility as a primary risk. We are always long volatility but as an outcome rather than a goal.
(1) Performance represents actual returns from a representative account through December 31, 2021. Equity Hedging returns were calculated after transaction costs and subtracting fees: management fee of 0.20% on total AUM plus a performance fee of 15% above a 0% return for the total Equity Hedging strategy. Performance reflects the reinvestment of dividends. All returns are expressed as Net Returns on AUM.
(2) “75/25” represents 75% allocated to equity asset classes and 25% to fixed income asset classes. “50/50” represents 50% allocated to equity asset classes and 50% to fixed income asset classes.
(3) SECOR forecasted return assumptions
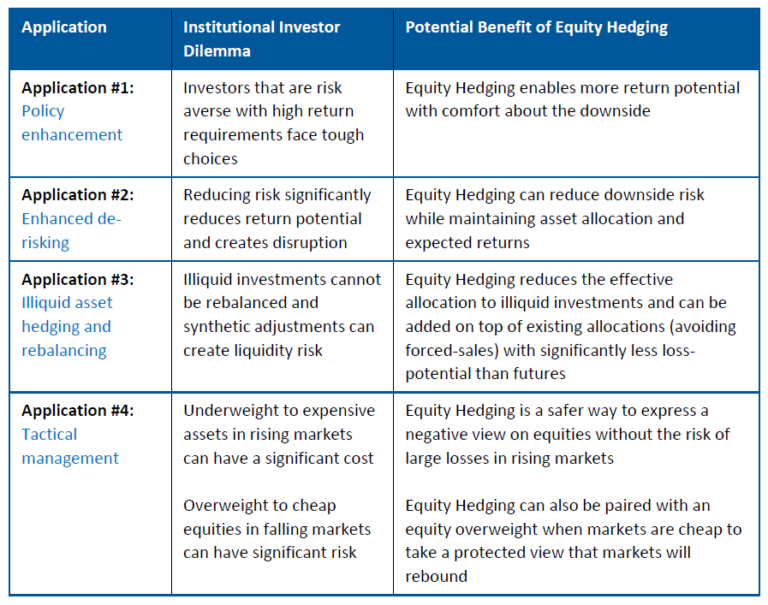
A key goal of investment planning is to make the tradeoff between risk tolerance and return potential. Investors allocate to risky assets to capture return premium and try to find an allocation that meets return requirements within their risk constraints (most typically their tolerance for losses). The required return and tolerable loss limit are often incompatible, requiring significant compromise. Cost-managed Equity Hedging can significantly change the tradeoffs.
By focusing on loss potential and cost control, Equity Hedging enables investors to build more efficient portfolios from a return vs. drawdown perspective. When equity and Equity Hedging are combined, the resulting Hedged Equity profile has:
For the examples that follow, we assume a total cost of hedging (net reduction in return expectations on hedged assets) of 75 bps per annum over a full cycle. This cost incorporates option premium, potential hedge gains, and SECOR’s cost reduction. For comparison, a typical Put Hedge strategy would cost more than 3% per year.
Hedged 75/25 vs. Basic 50/50 (2)
In the example below, we show how Equity Hedging can be used for return enhancement. Adding Equity Hedging and reallocating to Equities increases returns by more than 30 bps while slightly improving loss potential.
This improvement is net of the two main costs of hedging:

Case Study: A large US Defined Benefit Pension with a poor funding position and a cash-constrained sponsor needed to earn high returns and maintain and recover their funding position, but absolutely could not tolerate surprise deficit recovery contributions. To protect against losses, this client was heavily allocated to cash and had the bulk of their return-seeking investments in defensive hedge fund managers.
We worked with this client to add Equity Hedging and move to a more return focused asset mix. Having protection could help convert defensive hedge fund managers to long-only managers with higher return potential. The reduction in (2-and-20) fees they were paying for active defense was far more than the 75 bps cost of hedging.
We hoped that these changes would allow the client to improve performance versus peers, reduce their funded status deficit, and place them on the path to de-risking the plan.
(2) “75/25” represents 75% allocated to equity asset classes and 25% to fixed income asset classes. “50/50” represents 50% allocated to equity asset classes and 50% to fixed income asset classes.
(3) SECOR forecasted return assumptions
Downside-focused de-risking using Equity Hedging can be significantly more tolerable than traditional de-risking. Investors can potentially see significantly reduced loss potential while maintaining return targets, upside potential, and existing physical asset allocations.
This less-disruptive, asymmetric de-risking can be an extremely powerful alternative to traditional de-risking for:
Below is an example of using Equity Hedging to reduce risk. By allocating 3% of cash and 30% notional protection, we are able to match the loss reduction of a 25% traditional asset reallocation but with a 40 bps return advantage.
Case Study: Large UK DB Pension Scheme completed their actuarial valuation process and realized they were better funded than they had previously thought. Their funding level was suddenly at a point where de-risking was required. Markets had been volatile and geopolitical events had become increasingly scary. Strategy changes required agreement across multiple stakeholders and usually took a year or more to analyze and approve.
Rather than scramble to design and approve a new Pension Glide Path, this client worked with us to de-risk using a mix of Equity Hedging and LDI overlays. Because the new hedges fit on top of the existing asset allocation and the return drag was minimal, the alternative de-risking approach was approved within a week. The client sought to achieve the same protection as they would have sought from traditional de-risking with a significantly higher return and more upside.
Private Equity is in the middle of a spectacular run and distributions continue to be slow. Many of our clients are now struggling to figure out what to do with their resulting overweight positions in Private Equity.
As illiquid allocations rise, the overweight position causes two problems:
Most Private Assets cannot be sold without a steep penalty. This can be a nuisance for investors trying to match their strategic policy targets and downright terrifying for investors who have a view that valuations are stretched.
While traditional overlay hedges are generally a good solution for quick rebalancing, they are a logistical nightmare for illiquid assets. For a typical overlay, hedges are paired with liquid investments and then liquid gains offset hedge losses. For illiquid assets, there are no liquid gains. Instead, hedge losses must be covered by a different source of liquidity and can further create liquidity stress.
Our Equity Hedging program is a better solution. Downside-focused hedges are designed to payoff significantly more in falling markets than they can lose in rising markets. As a result, there is much less chance that the hedge would create liquidity stress.
Example Benefits of Equity Hedging in Rising Equity Scenarios: (4)
(4) For illustrative purposes only
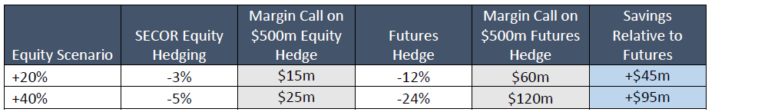
Note: Assumes a 1:1 hedge with SECOR Equity Hedging and a 60% hedge with futures.
For a $500 million hedge, our Equity Hedging outperforms a futures overlay by $45 to $95 million.
Case Study: Large top-decile Endowment has seen their Venture Capital portfolio nearly double in value over less than three years. As a result, the endowment is overallocated to equities, China, technology, and Illiquid assets. Distributions have been slow, spending has remained stable, and donations have slowed post-covid. Liquidity is becoming a concern. They reached out to the market about a secondary sale but are only able to reduce their position at a significant discount. They have a futures-based rebalancing program but cannot afford to cover losses on equity futures if equities have another +20% year.
We worked with them to develop a custom Equity Hedging program tailored to their Venture portfolio. Rather than a traditional global equity benchmark, we focused on NASDAQ-100 index options as our benchmark. To address their China concerns, we found additional opportunities in single name put-spread collar hedges. They were able to hedge going into the late 2021 tech decline seeking protection from market downturns.
While many of our clients have a negative outlook for equities, most are reluctant to take a negative position in a market that rises year after year. Investors often lose more by being right and early than they do by being wrong. The combined impact of inflation, valuations, and turmoil has created significant volatility but little in the way of repricing – for now.
Predicting market direction is difficult. Getting the timing right is nearly impossible. Our Equity Hedging is designed to take a negative position in equities without the need to guess.
Below is a graphical comparison of the return on notional between a short equity position taken using futures and one taken using Equity Hedging. We estimate the response profile of the SECOR hedge using options struck at 90% of market levels and an upside equity beta consistent with history.
In this example, the futures hedge can lose more than four times as much in a 20% market rally.

Note: Assumes a 1:1 hedge with SECOR Equity Hedging and a 60% hedge with futures. (5)
(5) Source: SECOR Analytics, Optionmetrics
Case Study 1: In 2013, Europe was in the middle of a significant crisis and global equities were priced for a disaster, making equity attractive in any scenario where the EU remained in place and the banking system remained solvent. Our client paired an equity overweight with Equity Hedging seeking to capture the significant value if equity markets rallied and protect against losses in the event the crisis worsened.
Case Study 2: Markets began to rally after the 2016 election and by mid-2017 were looking expensive. Our client wanted to take a tactical position against the long run prospect for equities but was reluctant to underweight physical equities or sell futures in a market that was rising so steadily. We worked with this client seeking to add Equity Hedging in the place of a tactical short position and to be well-hedged through a steady assault of macro issues: Brexit, the late 2018 taper tantrum, and COVID-19.
In many ways, this appears to be an ideal environment for our Equity Hedging strategy:
We have discussed four common uses of our strategy in this note, but these are just examples. A strategy that helps investors protect against asset losses when needed without disrupting the existing allocation is a valuable tool that we think has a role in every institutional investor’s toolkit.
Disclosures
Except where otherwise indicated, the information contained in this presentation is based on matters as they exist as of the date of preparation of such material and not as of the date of distribution or any future date. This document does not constitute advice or a recommendation or offer to sell or a solicitation to deal in any security or financial product. It is provided for information purposes only and on the understanding that the recipient has sufficient knowledge and experience to be able to understand and make its own evaluation of the proposals and services described herein, any risks associated therewith and any related legal, tax, accounting or other material considerations. To the extent that a reader has any questions regarding the applicability of any specific issue discussed above to their specific portfolio or situation, they are encouraged to consult with the professional advisor of their choosing, and recipients should not rely on this material in making any future investment decision.
We do not represent that the information contained herein is accurate or complete, and it should not be relied upon as such. Opinions expressed herein are subject to change without notice. Certain information contained herein (including any forward-looking statements and economic and market information) has been obtained from published sources and/or prepared by third parties and in certain cases has not been updated through the date hereof. While such sources are believed to be reliable, SECOR does not assume any responsibility for the accuracy or completeness of such information. SECOR does not undertake any obligation to update the information contained herein as of any future date.
Any illustrative models or investments presented in this document are based on a number of assumptions and are presented only for the limited purpose of providing a sample illustration. Any sample illustration is inherently subject to significant business, economic and competitive uncertainties and contingencies, many of which are beyond SECOR’s control. Any sample illustration may not be reflective of any actual investment purchased, sold, or recommended for investment by SECOR and are not intended to represent the performance of any investment made in the past or to be made in the future by any portfolio managed or advised by SECOR. Actual returns may have no correlation with the sample illustration presented herein, and the sample illustration is not necessarily indicative of an investment that SECOR will make. It should not be assumed that SECOR’s investment recommendations in the future will accomplish its goals or will equal the illustration provided herein.
The statements in this presentation, including statements in the present tense, may contain projections or forward-looking statements regarding future events, targets, intentions or expectations. Due to various risks and uncertainties, actual events or results may differ materially from those reflected or contemplated in such forward-looking statements. Past performance is no guarantee of future results. Investments are subject to risk, including the possible loss of principal. There is no guarantee that projected returns or risk assumptions will be realized or that an investment strategy will be successful. No representation, warranty or undertaking is made as to the reasonableness of the assumptions made herein or that all assumptions made herein have been stated. Different types of investments involve varying degrees of risk, and there can be no assurance that the future performance of any specific investment, investment strategy, or product made reference to directly or indirectly in this document, will be profitable, equal any corresponding indicated performance level(s), or be suitable for your portfolio.
Equity Hedging: Practical Applications in a Challenging Environment Read More »

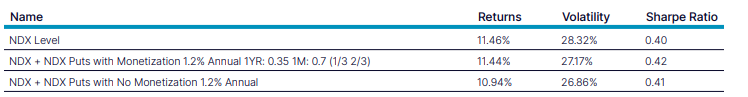
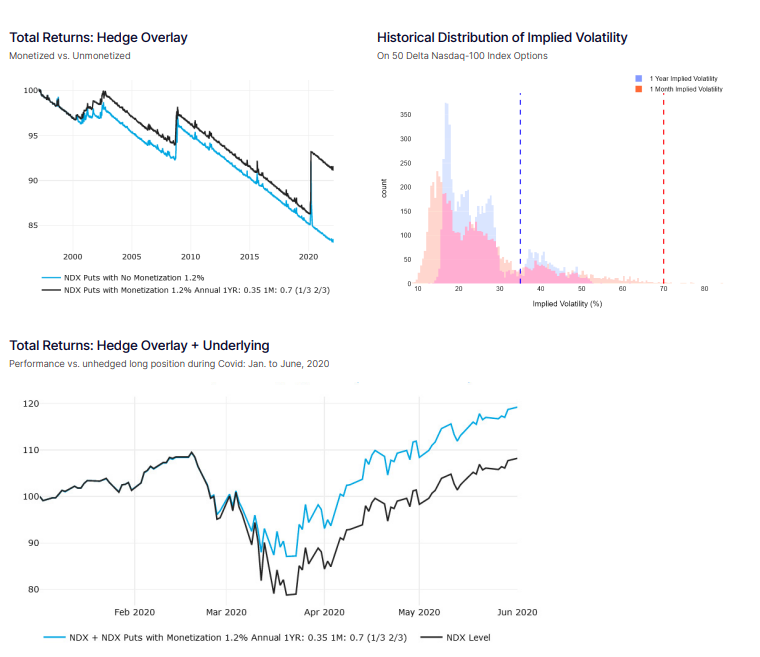
We explore the effects of an implied volatility based monetization scheme on a laddered put strategy on the Nasdaq-100 Index (NDX). The strategy holds 1, 2, and 3 month put options on NDX struck 20% out of the money. We purchase new 3 month puts at each third Friday expiry, spending 10bps per month (1.2% annually) of a total portfolio notional. We also analyze performance with a joint long position in NDX to demonstrate the value of systematic monetization of options contracts to lock in gains from adverse market events. Specifically, when a monetization event occurs, proceeds from the sale of puts are stored in an interest bearing cash account until the next roll day when proceeds are invested firstly into a new 3 month put and the remainder into NDX. Implied volatility is referenced as the 50 delta 1 year implied volatility and the 50 delta 1 month implied volatility. The study period ranges from January 1st, 1997 to February 15th, 2022.
We found that there was a significant benefit to including an implied volatility based monetization scheme in reducing impact from market drawdowns. In our study, monetization served as an effective mechanism to capture gains from adverse market events. We found that the monetized strategy reduced annual volatility by 115bps while returns were reduced by only 2bps. By contrast, the unmonetized strategy was effective in reducing risk, but with significant cost as annual returns were lowered by 52bps.
As a standalone overlay (i.e. not including the underlying asset), the monetized strategy outperformed the unmonetized version on a cumulative basis. The unmonetized strategy realized cumulative returns of 16.78% while the monetized strategy realized cumulative returns of 8.77%. The maximum 1 month return of the monetized strategy was 6.26% vs. only 1.89% in the unmonetized strategy.
Historical and simulated index performance is not necessarily indicative of future results. The information provided in this document does not constitute investment advice. Volos is not an investment advisor. Volos and its affiliates accept no responsibility whatsoever for any loss or damage of any kind arising out of the use of any part of the company products or the information contained therein.
© Copyright 2022. All rights reserved. Nasdaq is a registered trademark of Nasdaq, Inc. 1473-Q22
Monetizing Nasdaq-100® Tail Hedges Read More »

Harold is the architect of Transtrend’s Diversified Trend Program, responsible for R&D, portfolio management and trading. Harold was born and raised on a dairy farm in Drenthe. And from a young age, he has been intrigued by linking mathematics to the real world around us.
He graduated in 1990 with a Master’s degree in Applied Mathematics from the University of Twente in the Netherlands. In the final phase of his studies, while working on the project that would later become Transtrend, he became fascinated by the concept of leptokurtosis — or ‘fat tails’ — in probability distributions, a topic which has inspired him throughout his career.
Harold’s approach to markets is best described as a combination of a farmer’s common sense and mathematics, never losing sight of the underlying fundamentals.